
A plain guide to adventure attraction ROI: the payback formula, three worked examples and the real life adjustments investors should make.
Every investor asks the same question: how fast will this attraction pay for itself? Brochures often quote payback in months, but real payback depends on footfall, pricing, staff, downtime and season. This guide shows how adventure attraction ROI really works, with a simple method you can use on your own numbers.
The payback formula in plain words
Payback period is simply your total investment divided by the cash the attraction earns each month after running costs.
Payback (months) = Total investment / (Monthly revenue minus monthly running costs)
The trick is to count everything honestly on both sides. Investment is not just the equipment price. Monthly revenue is not just a busy Sunday multiplied by 30.
What goes into total investment
- Equipment price and safety gear.
- Freight, duties where applicable, and installation, which is quoted per project.
- Foundations, civil works, power and safety surfacing.
- Theming, signage, queue lines and shade.
- Staff training before opening and a first year spares kit.
- Launch marketing.
What goes into monthly revenue
Build revenue from the ground up:
- Riders per hour at realistic capacity, not the theoretical maximum. Use 50 to 70 percent of the stated capacity for peak hours.
- Peak and off peak hours. Weekends and holidays may run near capacity, weekday afternoons far below.
- Operating days. Remove monsoon closures, maintenance days and bad weather.
- Average ticket price, after combo discounts, group rates and free passes.
- Secondary spend from photos, videos, food and merchandise linked to the ride.
What goes into monthly running costs
- Operator and supervisor salaries for every opening hour.
- Power, especially for rides with motors, compressors or lighting.
- Maintenance, inspections and replacement of wear parts such as ropes, harnesses and brake pads.
- Insurance, rent or revenue share, and marketing.
- Payment gateway and ticketing fees.
Three worked examples
These examples use indicative numbers to show the method. Your own figures will differ.
| Item | Resort zipline | Mall axe throwing (4 lanes) | Park anchor thrill ride |
|---|---|---|---|
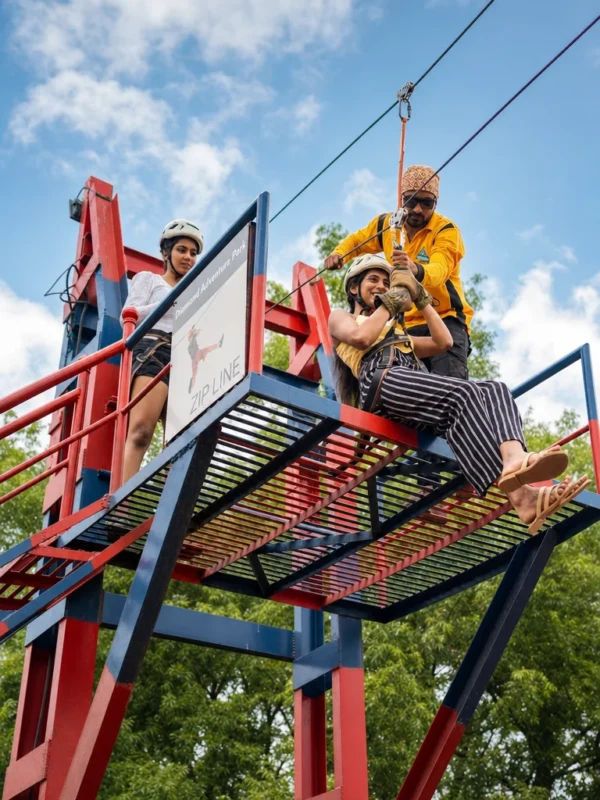
| Total investment | Rs 18 lakh | Rs 12 lakh | Rs 1 crore |
| Paying guests per month | 1,500 | 2,000 | 4,000 |
| Average ticket | Rs 500 | Rs 450 | Rs 1,200 |
| Monthly revenue | Rs 7.5 lakh | Rs 9 lakh | Rs 48 lakh |
| Monthly running costs | Rs 3 lakh | Rs 5.5 lakh (incl. rent) | Rs 14 lakh |
| Monthly operating cash | Rs 4.5 lakh | Rs 3.5 lakh | Rs 34 lakh |
| Simple payback | About 4 months of operation | About 3.5 months | About 3 months |
These look fast, and in a strong location they can be. But notice the assumption behind each: steady guest numbers every month. Now apply real life.
Adjusting for real life
Seasonality, ramp up and downtime stretch payback for most projects. Apply three adjustments:
- Ramp up: the first 3 to 6 months often run at 40 to 60 percent of steady state while word spreads.
- Season: outdoor attractions in many Indian regions lose 2 to 4 months a year to monsoon or extreme heat.
- Downtime: plan for some days lost to maintenance and inspections.
After these, a payback that looked like 4 months on paper often becomes 10 to 24 months in practice. That is still a healthy return for leisure assets, which commonly run for many years with good maintenance. Investors who plan on the adjusted number are rarely disappointed.
Test three scenarios, not one
A single forecast hides risk. Build three versions of your model and look at all of them before you commit:
- Cautious: 60 percent of your expected guests, a lower average ticket and a longer ramp up. If the project still pays back within your comfort limit, it is a sound bet.
- Expected: your best honest estimate, based on similar attractions in similar locations.
- Strong: a good location and strong marketing, with steady group bookings.
Lenders and partners trust the cautious case more than the strong one. Show it first.
Returns that do not show up in ticket sales
For many owners, the attraction is not the only source of return. A resort with an adventure zone often sells more room nights, longer stays and more food. A mall with an experience zone sees longer visits and better footfall for neighbouring tenants. A school or club gains admissions and memberships. Count these indirect gains, even roughly, when you judge the investment. They are often the real reason the project makes sense.
What makes payback faster
- Location and visibility. The same ride earns very differently at a highway stop, a hill station and a mall.
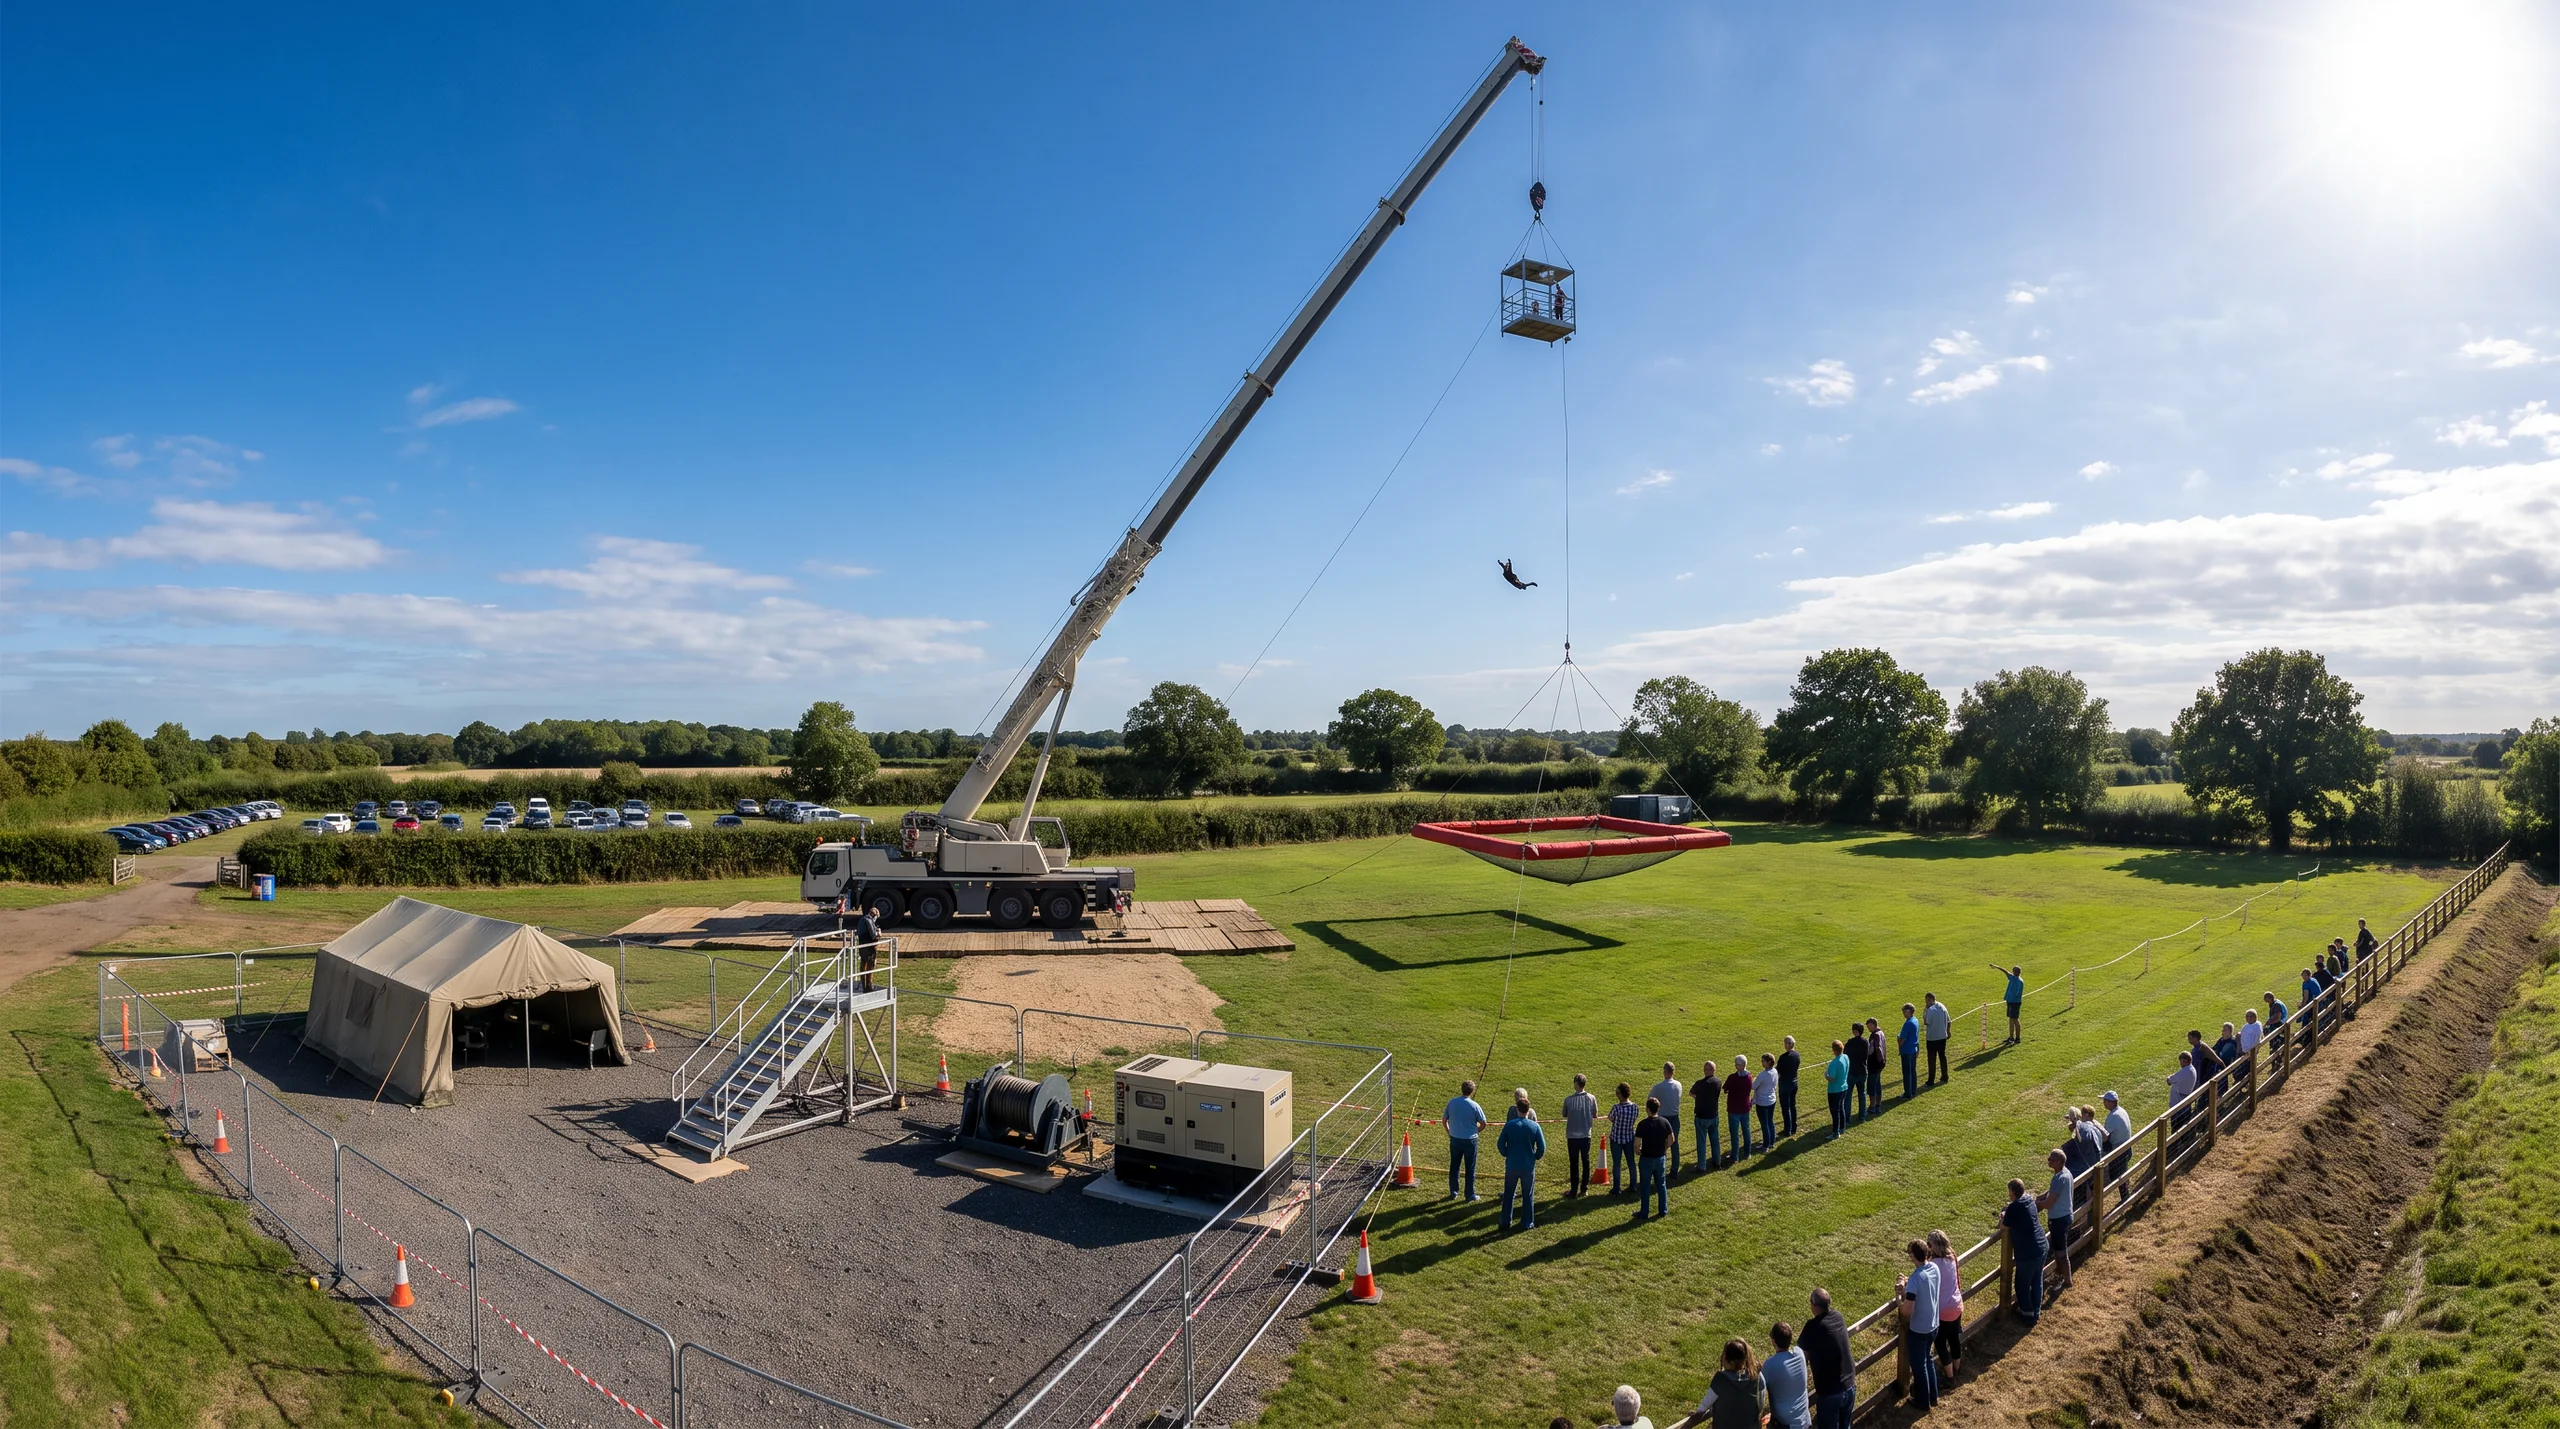
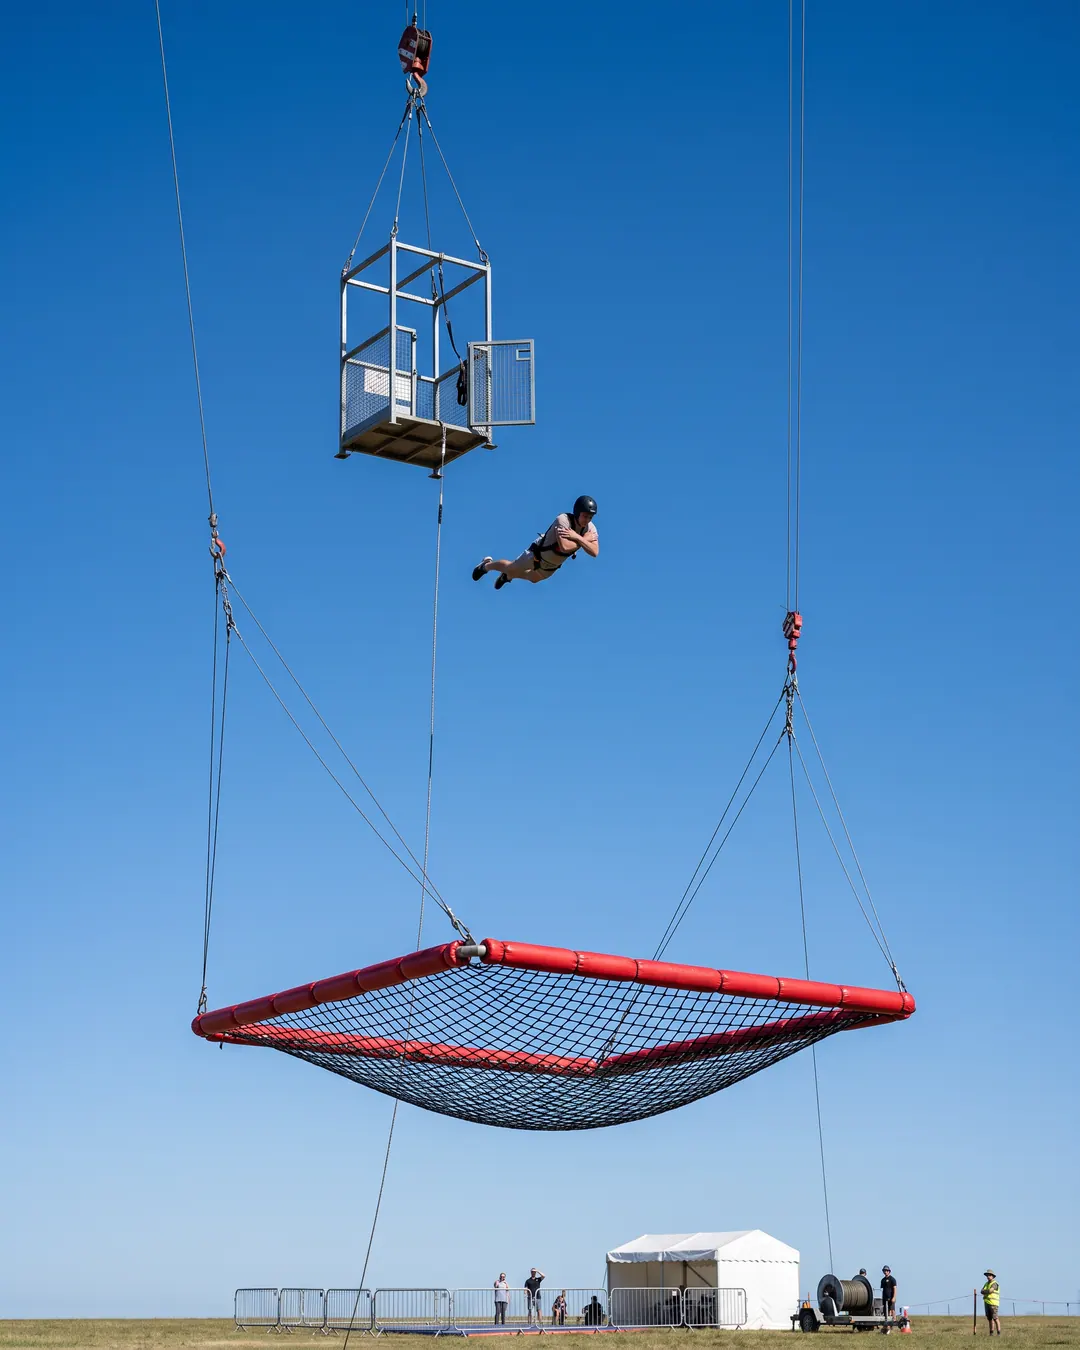
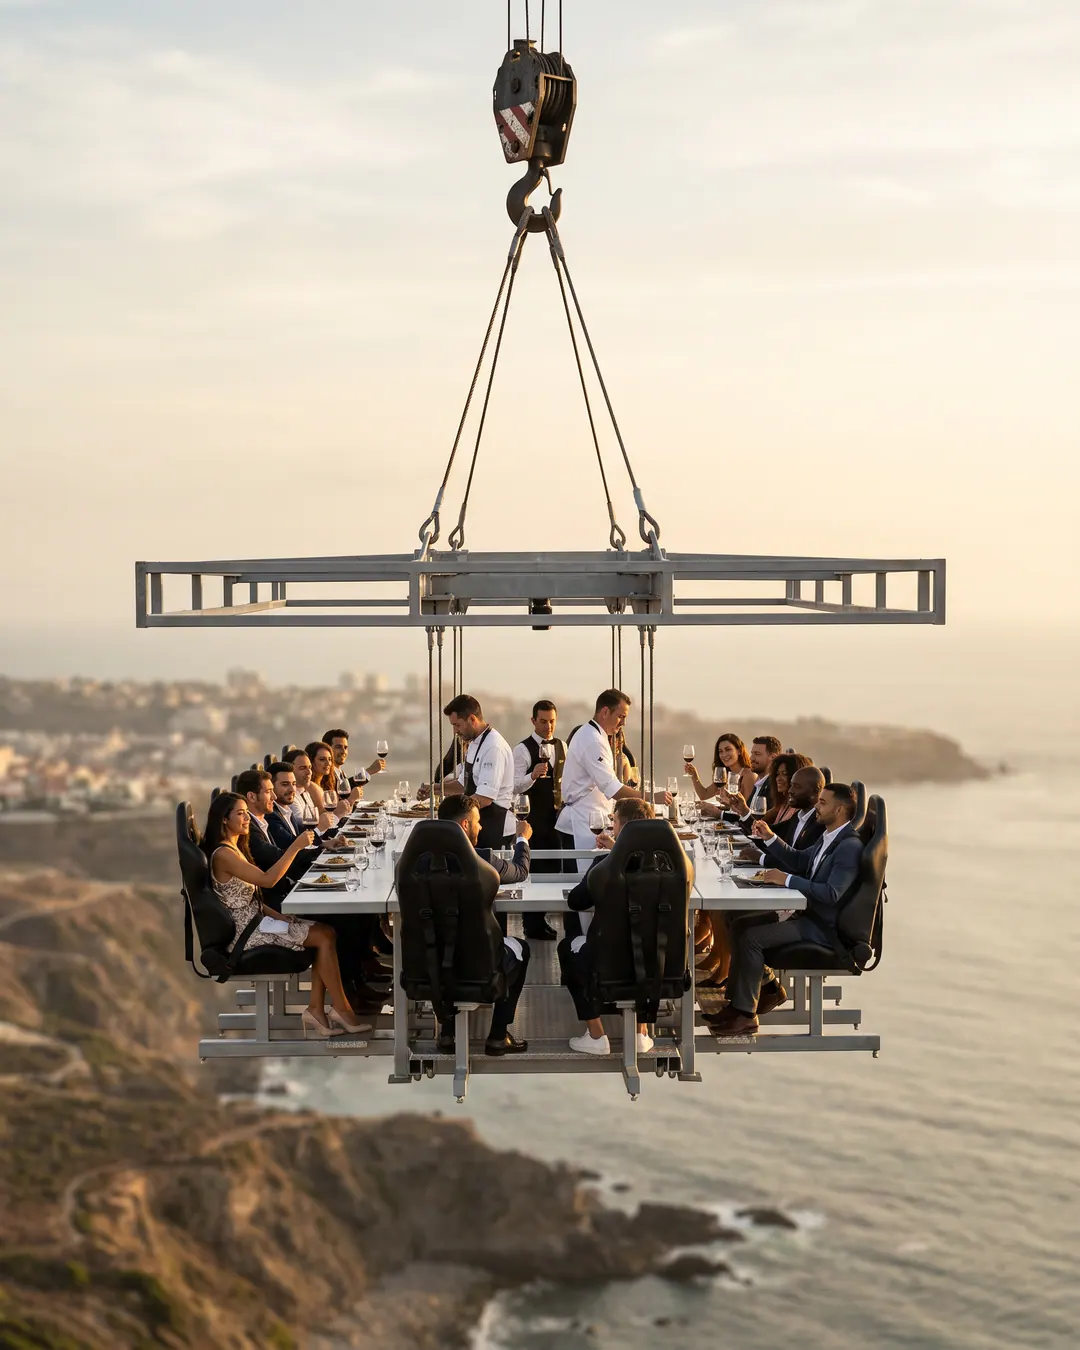
- Premium signature attractions. A canyon swing, SCAD free fall jump or fly dining platform carries a high ticket and brings free social media reach.
- High throughput. Rides with short cycles, such as a giant swoop swing or a zip cycle, sell more tickets per hour.
- Group and event sales. Corporate days, school trips and private parties fill quiet weekdays.
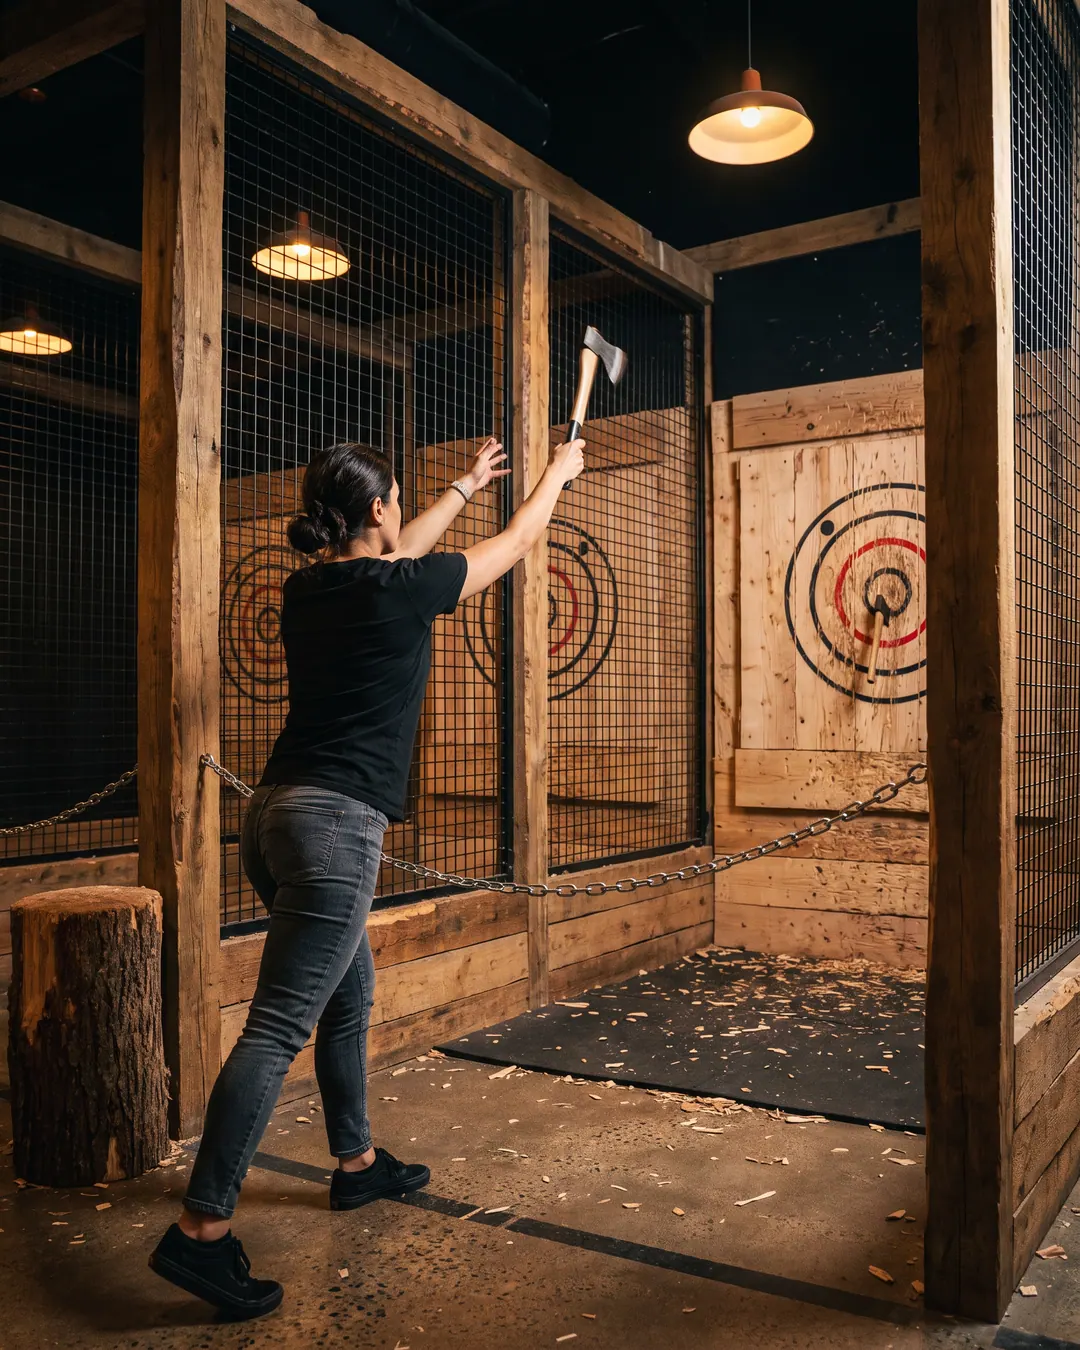
- Low staffing per guest. Lanes and walk-throughs such as axe throwing keep payroll small.
- Bundles. Combo passes lift the average ticket and spread guests across attractions.
A quick example of throughput in action
Compare two rides that each cost about the same. Ride A takes 4 guests every 3 minutes, about 80 an hour. Ride B takes 1 guest every 5 minutes, about 12 an hour. Even if Ride B charges double, Ride A can sell far more in a busy afternoon. For payback, ask every supplier for the realistic guests per hour, the staff needed to run it, and how long the daily checks take before opening.
What slows payback down
- Buying on headline price and paying later for missing foundations, power or spares.
- Choosing rides that do not suit the local audience or climate.
- Undertrained staff, which slows throughput and raises incident risk.
- No marketing budget after launch.
How JumpKing helps
JumpKing plans, designs and delivers attractions with one point of contact from brief to opening, and shares capacity and running cost inputs so you can build your own ROI model. Warranties are as per the manufacturer’s terms, confirmed in your quotation.
You can browse individual attractions, rides and games with indicative prices in the JumpKing shop.
Questions buyers ask
What is a good payback period for an adventure attraction?
Many investors aim for 12 to 36 months on a realistic, season adjusted model. Strong locations can do better; weak ones take longer.
Which attractions have the fastest ROI?
Usually attractions with low staffing and high throughput in busy locations, such as lanes, walk-throughs and short cycle rides. Signature rides win on ticket price.
Should I lease the space or share revenue?
Revenue share reduces risk in the early months. Fixed rent can work better once footfall is proven. Model both.
Can you guarantee returns?
No honest planner can guarantee returns. Results depend on location, pricing, operations and marketing. What good planning does is make your assumptions clear and realistic.
Want to test your numbers? Share your site and budget and get attraction options with capacity and cost inputs for your ROI model.